Domino's Q3 Quarterly Results: Sales Up, Comps Barely Move
Domino's third-quarter 2026 quarterly results show global retail sales up 3.2%, but U.S. same store sales rose just 0.3% as store growth carried the quarter.
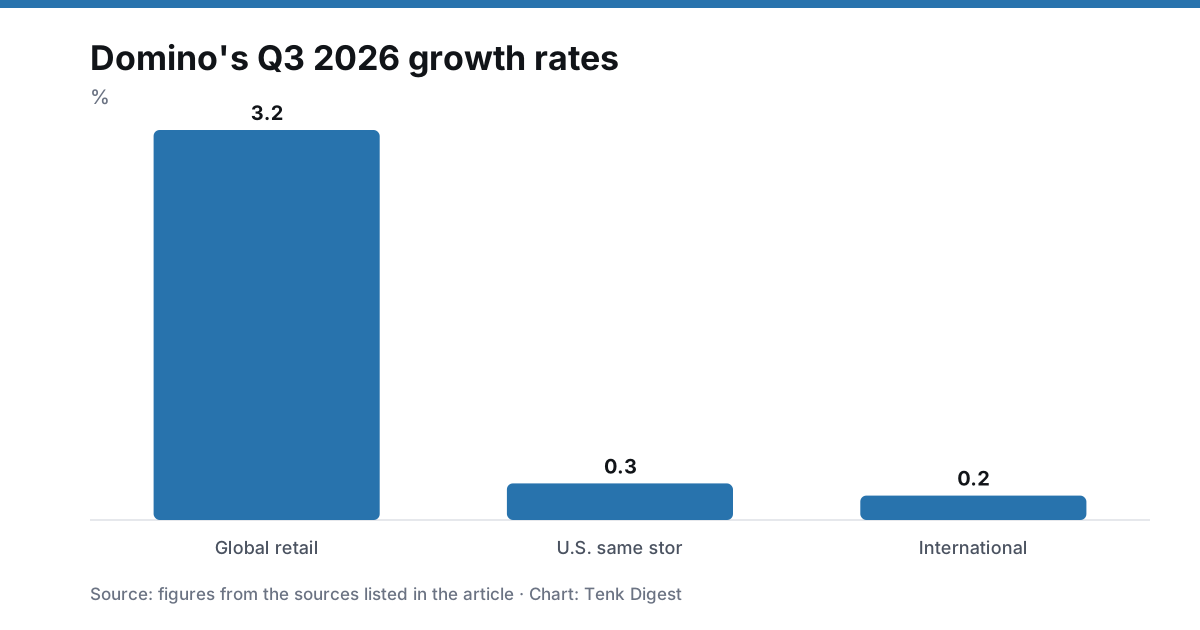
The news: Domino’s Pizza released its third-quarter 2026 financial results on October 13. The quarterly results point to a business growing mainly by adding stores. Existing locations are barely selling more than a year earlier.
By the numbers:
- Global retail sales growth, excluding foreign currency impact: 3.2%
- U.S. same store sales growth: 0.3%
- International same store sales growth, excluding foreign currency impact: 0.2%
- Global net store growth: 175 stores
- Net U.S. openings: 26
- Net international openings: 149
Why it matters: Same store sales are the main gauge of demand at restaurants that were already open a year ago. Both U.S. and international comparable growth landed at or near zero. That means most of the 3.2% rise in global retail sales came from a larger store base, not from more spending at existing locations.
The expansion split is lopsided. Of the 175 net new stores, 149 were outside the U.S. and 26 were in the U.S. International growth is therefore carrying the unit count. The U.S. business is adding stores slowly and growing comparable sales by only a fraction of a percent.
The big picture: Pizza delivery and carryout is a mature category, and the numbers fit a company in a measured growth phase. Retail sales rose steadily, but there was little momentum from existing stores. In a franchise-heavy system, net openings and global retail sales are often the more telling indicators of reach. Comparable sales show whether each store is getting busier or more productive. Here the two measures point in different directions: the system is getting larger, but not much busier per location.
The international figure is quoted excluding foreign currency effects. That strips out exchange-rate swings and gives a cleaner read on underlying demand. It still shows only 0.2% growth.
What’s next: Readers going through the full earnings report should look at three things:
- Whether U.S. comparable sales gain traction in coming quarters.
- Whether international net openings stay near the pace of this quarter.
- How the company describes profit trends and its outlook for the rest of the year.
Those details will show whether store growth alone can keep driving results if comparable sales stay flat.
Prepared with AI assistance from public sources and reviewed under our editorial policy. Not investment advice.